The best part of any test is checking your results, right? In high school, that meant watching the teacher wander around the room and handing back a stack of papers. Finally, your teacher called your name–excitement mixed with dread (depending on how much you studied) and you finally saw how well you did.
When it comes to understanding your hearing test results, though, things can be a bit more challenging and a bit less exciting. That’s because a hearing test is more about gathering information than about passing or failing. (Also, you don’t have to study beforehand, which is nice.)
What is a hearing test checking for?
Today’s the day of your hearing test. You walk into the hearing specialist’s office and you aren’t quite sure what to expect. Still, you do the best you can, placing the headphones over your ears and listening to a wide variety of tones and pings. To some degree, it’s almost like listening to really bland, nonsensical music. And you think you do pretty well.
When you were a kid, hearing screenings typically checked for any general problems or abnormalities. They were just checking to see if your right ear and left ear could hear at normal volume.
As an adult, the test you take is more sophisticated. Hearing loss tends to manifest in specific wavelengths first (usually the higher wavelengths) and then gradually progress from there. So modern hearing tests check your ability to hear on a wavelength-by-wavelength basis. That’s important to remember as you look at your results.
What do hearing test results look like?
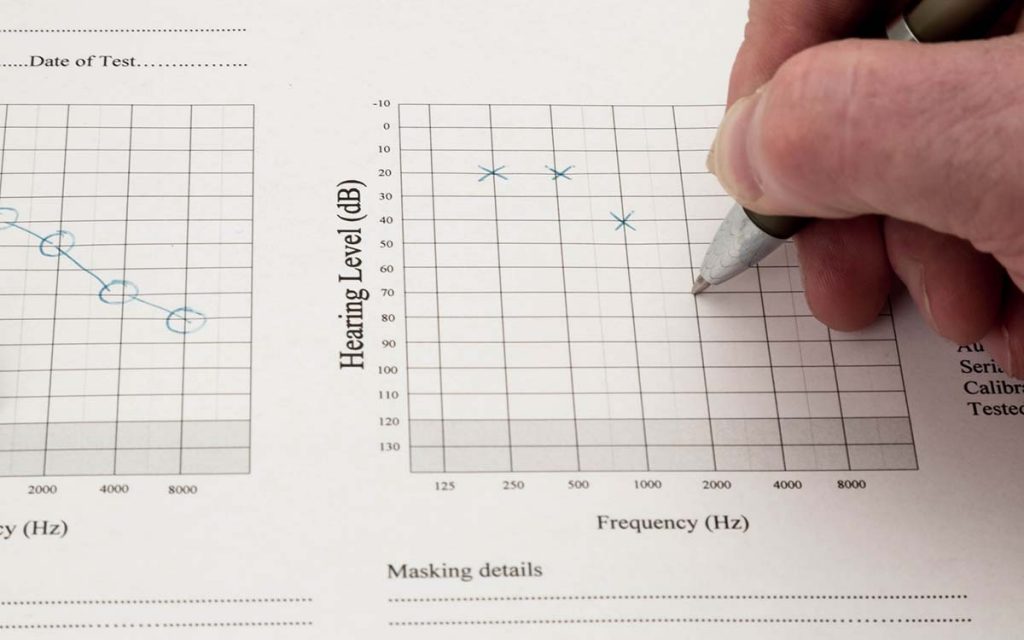
For most people, hearing test results will look like a simple graph. The technical term for these results is an audiogram. On the vertical axis is the volume level, measured in decibels, of each test sound. Softer sounds are displayed near the top of the graph. On the horizontal axis is the wavelength of the sound. (Usually, lower wavelengths are presented to the left and higher wavelengths to the right.)
Your results are then plotted on the audiogram. There will typically be six or so points per ear, and that means you’ll have twelve data points to look at.
The exact style, number of points, and so on, will probably change from clinic to clinic, but the underlying principle will be pretty consistent.
What should I look for?
First and foremost, the closer your results are to the top, the better. Those higher data points mean you’re able to hear quiet sounds–at least on that specific wavelength. If you’ve got high marks all across your audiogram, you can hear lots of quiet sounds (and that’s good, so give yourself a gold star).
Second, the further your data points dip–the louder the sounds have to be for you to hear them–the more significant your hearing loss may be. Typically, hearing loss is divided into five categories: normal hearing, mild hearing loss, moderate hearing loss, severe hearing loss, and profound hearing loss. The lower the data point, the closer to “profound hearing loss” you become.
A dip to the right
It’s not unusual to see a significant dip to the right side of your hearing test results. That’s usually what the early phases of hearing loss look like. Often, it’s the higher frequency sounds that begin to wane first. So your hearing specialist will likely take special note of the data points to the right of the graph (and that means you probably should too).
That said, hearing loss can initially present in other sound frequencies as well. That’s why your hearing screening will probe multiple wavelengths.
The sooner you notice, the better
Hearing tests are designed to be an early warning system. As we’ve written about before, even mild hearing loss affects your brain negatively. Getting treatment for hearing loss sooner means you have a better chance of minimizing hearing decline, side effects, and complications.
You don’t have to be fluent in hearing test results. But being able to read your own results can help you better understand your hearing loss may mean within the context of your own life.
In a sense, you’ve been studying for your hearing test your entire life. Once you get your results, you can finally take action.


